THE STEPS
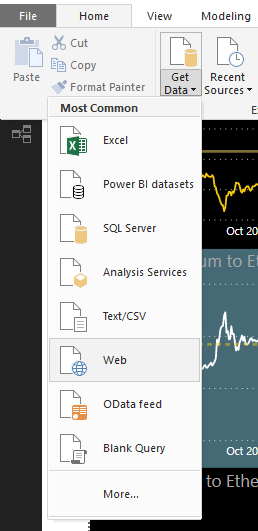
We begin by connecting to the data source. Since we will be mining live data, we select “web” in the Get Data options. Our data comes from Crypto Compare, and you will need an API Key to test your own.
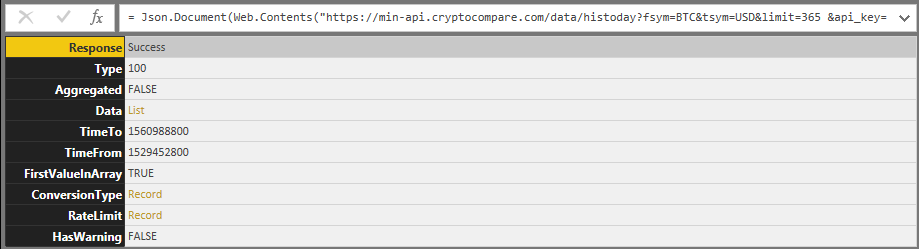
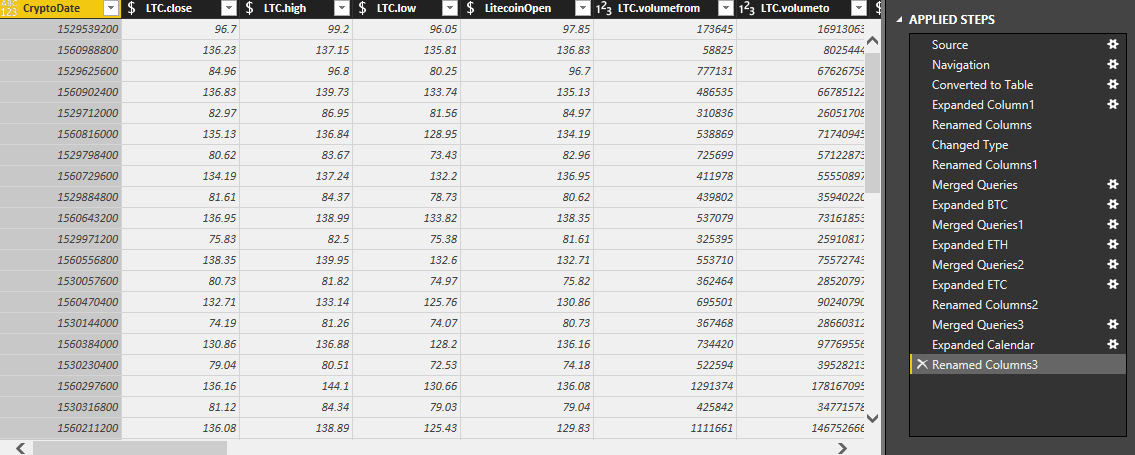
In the meantime, continue reading to see what we can do with real-time data. After a little ETL (Extract, Transform, Load) in Power Query Editor, you will have the following:
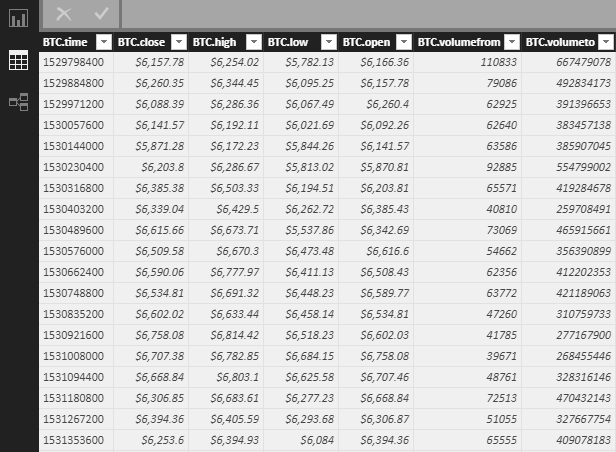
You can duplicate the table and steps, and in the API Call (in the URL) change BTC to ETH and get the Ethereum Data. Repeat for Ethereum Classic and Litecoin. You will notice that the Date is in a strange Integer format. Every day is separated by the number 86,400 (60 x 60 x 24) which is the number of seconds in a day. You can merge the BTC, ETH, ETC and LTC data using the integer for the date.
We want to drill down using the Time Dimension, while displaying a human-readable date. Therefore, we create a Calendar Table using Excel’s Today() function.

Using the Integer in the date which was pulled from the API call, we derive the Integer needed to multiply Today’s date (as an integer) styled “factor”, and then subtract 86,400 for each prior day.
Next we connect to this Excel document with Power BI and link the tables.
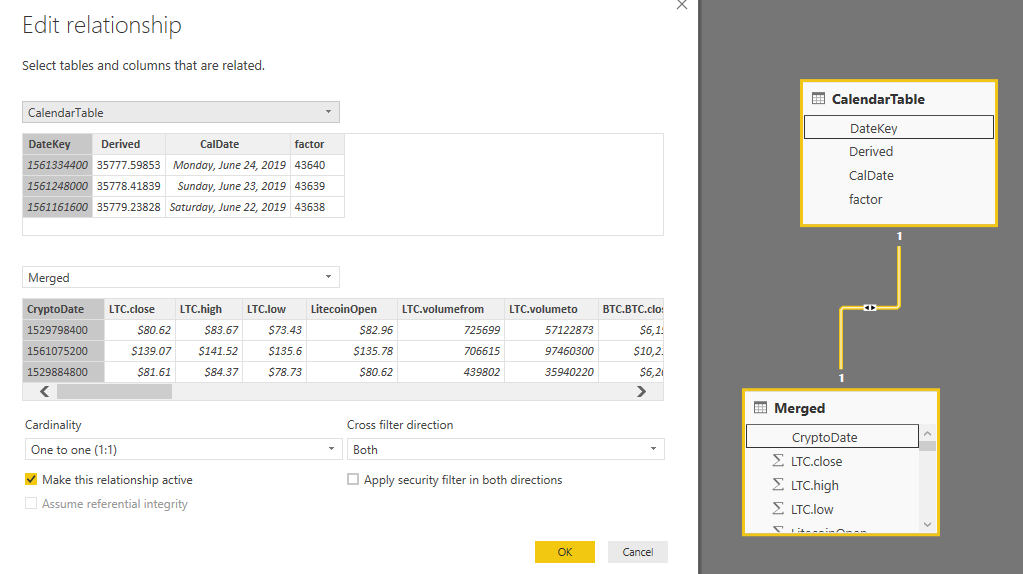
We link the tables in the Relationship Manager using a (1:1) One to One Cardinality with the Cross Filter going in both directions. The Primary Key is in the Calendar Table (DateKey) and the key for the Merged Table is styled CryptoDate.
Using DAX, we create Calculated Columns based on ratios (BTC/ETH et al.)

Since Crypto is currently on a Bull Run this Quarter, we will focus more on Swapping them based on Historic Ratios and the Average Ratios. The ratios are visualized above for multiple crypto currencies. We can see the ETH/LTC and BTC/LTC are both below average while the rest are above. We used this data to swap the appropriate currencies, instead of buying.